
THE NEXT STEP IS TO WEIGH WHAT MIGHT WORK BEST
We are going to develop a list of pros and cons for your lessons and strategies. What might work best? What would be great, but is out of reach financially or in terms of time or other resources right now? What sounds good, but might fall flat? Before you decide, we have some ideas for you to consider.
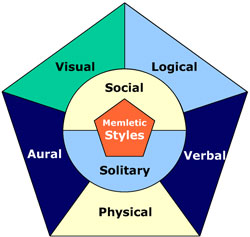
A visual of our complex learning styles
CONSIDER HOW PEOPLE LEARN
Not everyone learns the same way. Traditionally, learning theory has people in categories — you are a visual learner, you are a kinesthetic learner, etc. However, it’s obvious enough that most of us don’t necessarily fit in one category. Most of us have some strengths in terms of learning, and some weaknesses.
Here’s one thing to consider though — studies have shown that only 5-10% of learners are naturally auditory learners — meaning that we learn best when someone talks to us. 5-10%! So much for the college and high school lecture! So if you have a video of yourself talking that lasts an hour, only 5-10% percent of the people are doing great.
This isn’t to say don’t use videos — but think about it. A lot of us like videos if they show us how to do something. Think YouTube crafts! Think Khan Academy math. Think training for anything physical. How to use the kitchen in your shop? How to use machinery? How to do a math problem. Videos that show how to accomplish the task are great.
Your talking head is great for just a tiny bit, so that learners can connect with you or your staff, or the expert. After 5 or 10 minutes, a talking head is hard for most of us to learn from. Some slides or how-tos in a longer video will help.
Speaking of lectures, although almost none of us are naturals at learning through lecture — most of us learned to learn through lectures at school, and so we have methods for making it work for us. This is just another complexity for understanding learning. We can learn to learn in certain ways based on our environment or profession. Note-taking for those who learn by doing, photos of the blackboard/screenshots for those of us who learn by seeing are examples.
So how do most of us learn? 75-80% of learners do best through some combination of writing and visual representation, meaning graphs, charts, photos, infographics, flow charts. A good deal — around 60% or so also do well when they can do activities in order to learn. Make, order, try, etc.
Before you pin down your strategies completely, go to the next lesson, where we will try to characterize your particular average learner.